The Data Science Map Nobody Draws for You
A field map of data and AI — why the roles keep multiplying, and the one unmoving thing beneath all of them.
19 pages · No sign-up required
The Core Machine
What Is Software?
Ask ten people and you will get ten definitions. A set of instructions. A program. An application. An engine that runs a business. All of them are correct, and all of them describe the surface. Go deeper — past the language, past the framework, past whatever tool happens to be fashionable this year — and every piece of software ever written is doing the same simple thing: it takes data as input, performs some processing on it, and produces more data as output. That is the whole machine. A box with data going in and data coming out.
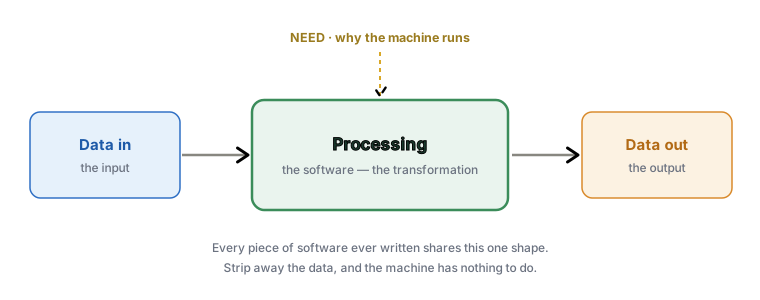
Now sit with a strange question for a moment. What happens if there is no data? Not “less data.” No data. Nothing to feed the box, nothing for it to produce. And the answer is quietly enormous: there is no software. There is no computer science industry. There are no advancements, no products, no companies — and no jobs, for any of us, in any of this. Strip away the data and the entire field simply switches off. The box has nothing to do.
Data is the single most important thing in this entire field.
Not the language we code in. Not the framework on our résumé. Data. If computer science has a supreme power sitting behind everything, it is data. And it behaves like one: whatever role we hold in this industry, if we treat data well, data will treat our careers well. Respect it, and it takes care of us. Here is the proof, and we have all lived it.
Tools come and go. Data stays.
The tools we used twenty years ago, we had probably already abandoned ten years ago. The tools we leaned on ten years ago, we have likely retired today. A new tool arrives, it is celebrated, it becomes the thing everyone must learn — and then the next one replaces it. That cycle never stops. But notice what we never do: we never throw the data away. We do not replace it. We only ever add to it. The tools are temporary. The data is permanent. Everything else in this field is scaffolding built around that one unmoving thing.
The Explosion
We only started creating digital data at scale a few decades ago — when computers moved from laboratories into businesses, from businesses into homes, and eventually into our pockets. That is a blink in human history. And in that blink, look at what happened.
In 2012, the world created roughly 6.5 zettabytes of data in a year. By 2020, that number had grown to around 64 zettabytes — almost a tenfold increase in just eight years. By 2025, it had crossed 180 zettabytes, and it continues to grow at well over 20% every year.
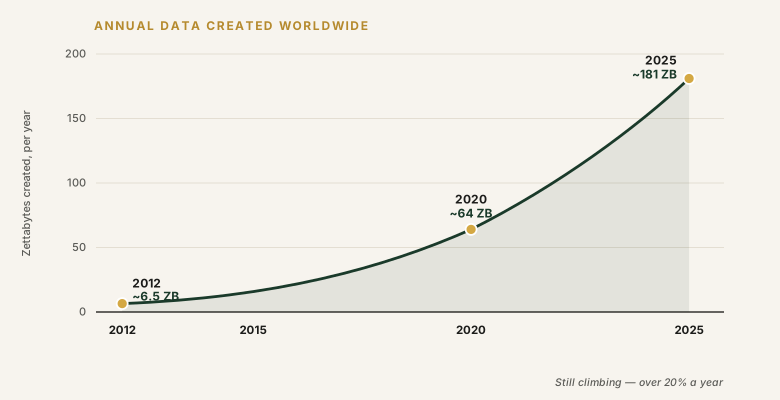
If a zettabyte is difficult to picture, do not worry — that is the point. It is a number with twenty-one zeroes after it. Nobody can truly feel a zettabyte. What you can feel is this: today, the world creates more data in a single day than humanity created over many decades of the early digital era. Whether that comparison is 2003, 2005, or another milestone is less important than the reality it illustrates — the scale has become almost unimaginable.
Now do not just hold that number — watch its shape. It is not growing steadily, a little more each year. It is bending upward, faster and faster, and every new technology we invent bends it steeper. The web bent it. Mobile phones bent it. Social media bent it. Cameras, sensors, IoT devices, cloud computing, and now AI systems generating data of their own — each one has added another firehose to a river that was already flooding. The curve does not flatten. It accelerates.
But the firehoses are only half the story. Creating data was never the hard part — we have always been able to generate more of it. The real question was whether we could afford to keep it. And for a long time, we could not. When storage was expensive, data was something you threw away. You sampled it. You summarised it. You deleted the logs at the end of the week because holding on to everything simply cost too much. Processing had the same ceiling.
Then both floors fell away. Storage became cheaper year after year until keeping data became cheaper than deciding what to delete. Computation followed the same curve — faster, cheaper, and eventually available on demand through the cloud. As networks became faster and more reliable, moving data across systems and across the world became practical at an unprecedented scale. The default flipped.
For decades, we asked: “Is this worth storing?”
Now we ask: “Why would we throw it away?”
That shift turned steady growth into an explosion. And the cycle became self-reinforcing. Cheap storage and compute made it economical to keep more data. More data created demand for better infrastructure. Better infrastructure reduced costs even further, making it economical to keep even more. Storage, computation, connectivity, and data growth stopped being separate trends — they became a flywheel, each accelerating the others.
And here is the point I want you to sit with, because it connects back to everything so far. All of this data — this impossible, accelerating ocean of it — is the raw material of our entire industry. Every piece of data has to be collected, transmitted, stored, cleaned, transformed, secured, governed, analysed, and ultimately turned into something useful. None of that work happens automatically. So the explosion of data is not just a statistic to open a presentation with.
It is the reason our industry exists.
Every major discipline we have built over the past few decades — every tool, every role, every architecture — emerged because we needed a better way to manage, understand, and extract value from an ever-growing volume of data. Once you see it for what it is, the evolution of our field stops looking like a collection of disconnected technologies. It begins to look like one continuous response to a single, ever-growing problem.
But it was not just the quantity of data that changed. The nature of data changed too. So the next question is not how much data we have. It is what kind of data we are actually dealing with.
The Three Kinds of Data
For a long time, the answer to that question was simple. Data meant rows and columns. Think of a bank ledger, an inventory sheet, or a table of customers. Every record had the same shape — a name here, an amount there, a date in its column. Everything lined up.
This is what we call structured data: data that fits neatly into a table, with a fixed schema decided in advance. You knew what every field was before a single row arrived. And it was wonderful to work with because it was predictable — you could store it in a relational database, query it with SQL, and trust that row two looked just like row one. For decades, this was essentially the whole world of data.
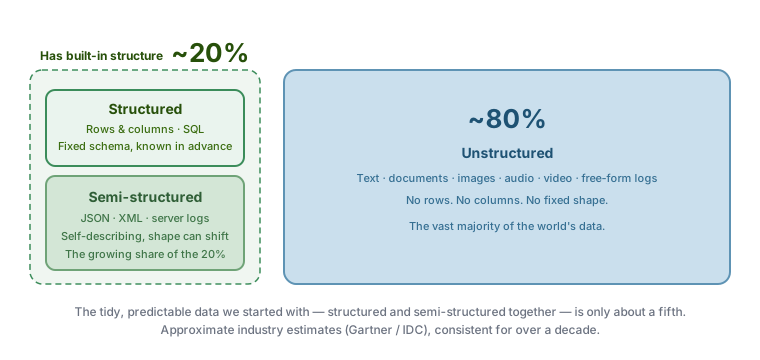
But the world does not actually come in neat tables. As data started pouring in from everywhere — websites, applications, phones, sensors — more and more of it refused to sit still. Some of it had structure, but not a rigid one. A JSON file from an application. A log entry from a server. An XML document. These carry their own labels and nesting, but the shape can change from one record to the next. We call this semi-structured data. It has organisation, but not a fixed schema. In many ways, it describes itself as it goes.
And then there was the largest category of all — the data with no rows, no columns, and no built-in structure at all. The text of an email. A photograph. A voice recording. A video. A scanned document. A conversation with an AI assistant. None of it fits a table. You cannot put a sunset into a column or a customer’s angry paragraph into a neatly typed field. This is unstructured data. And here is the part that matters. It is not the exception. By most estimates, around 80% or more of the world’s data is unstructured. The tables we started with turned out to be a small, tidy island in a vast, messy ocean.
We did not just get more data. We got a different kind of data.
It was not that the old tools were bad — they were solving the problem they had been built to solve. But the problem itself had changed. A relational database and a SQL query are perfect for a table of transactions, and almost useless for a million photographs or a mountain of free-form text. The databases were no longer enough. The architecture was no longer enough. The workflows were no longer enough. The industry itself had to evolve. And that is exactly where our story turns next.
The Evolved Data Landscape
We just said the industry had to evolve. This is what that evolution actually looked like — and it is the clearest place to see a pattern that repeats throughout this field: when a tool stops being enough, a new discipline is born, and with it, a new kind of job.
Then: The Structured Enterprise World
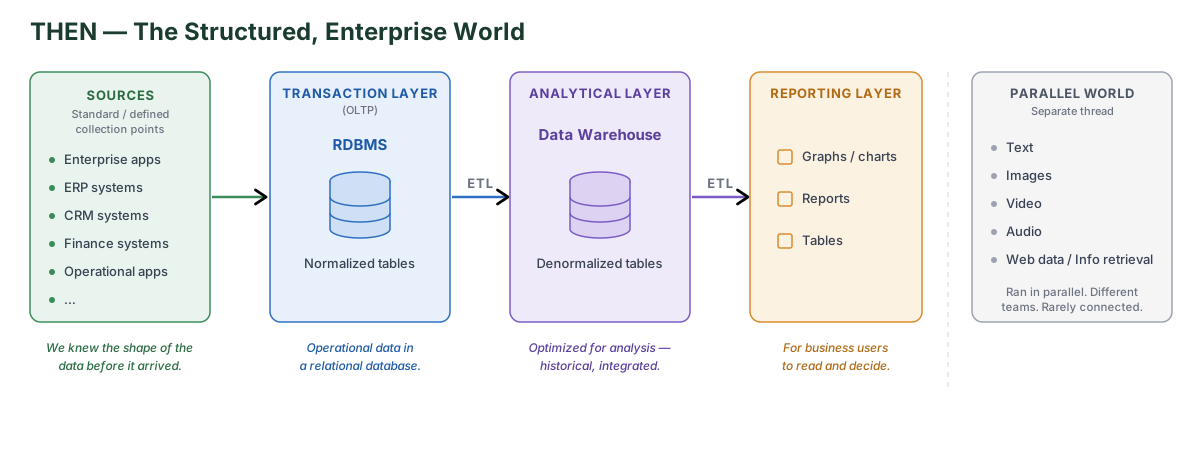
For decades, the enterprise data landscape had a clean, three-part shape. It began with defined sources — standard, predictable collection points where the structure of the data was known before it arrived. Data flowed into relational databases storing normalised tables. ETL — Extract, Transform, Load — moved it into analytical data warehouses built for analysis, and a second ETL step produced reports, graphs, and dashboards. Three layers. Two ETL steps. Everything structured from start to finish.
The architecture was not wrong. It was perfectly optimised for a world where businesses generated mostly structured data from well-defined systems. ETL itself was largely performed by mature tools — the tool moved the data, orchestrated the workflow, and even handled much of the security and access control. Running alongside this enterprise world, however, was another ecosystem built around unstructured data — web text, documents, images, audio, video, information retrieval, search engines, NLP, speech, and computer vision. For decades, that world evolved largely independent of enterprise data platforms. Only with the arrival of GenAI and LLMs did the two worlds begin to converge.
Now: A Much Larger Landscape
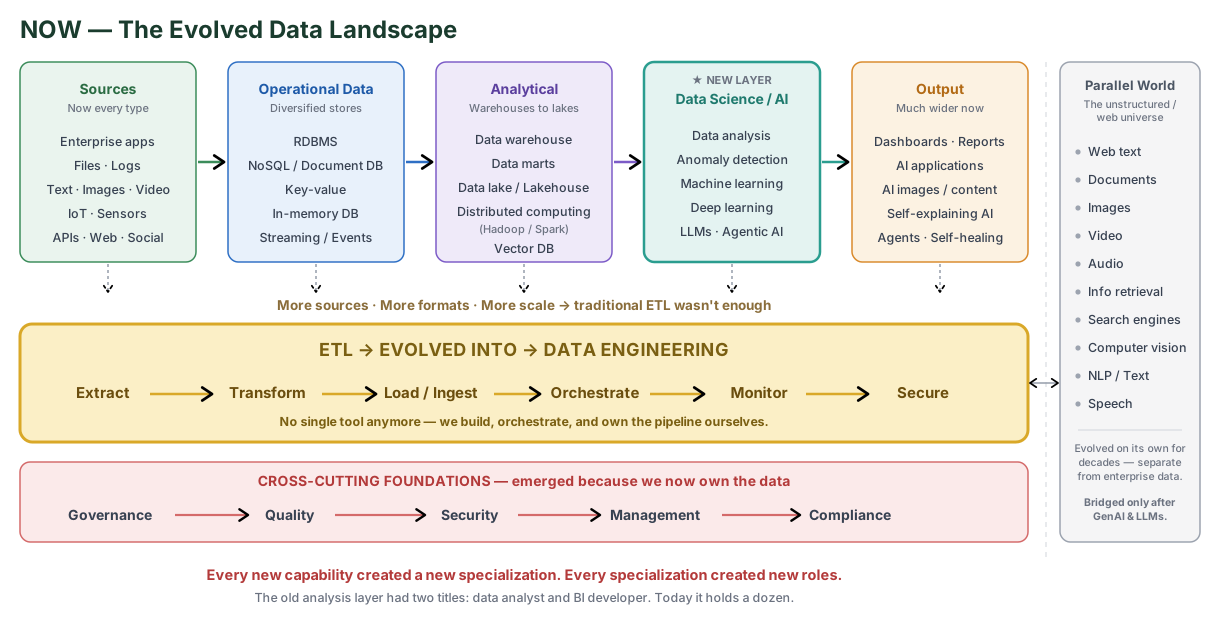
The old architecture did not disappear — it expanded. Sources now include enterprise applications, files, logs, APIs, IoT devices, web data, social platforms, documents, images, audio, video, and streaming data. The operational data layer expanded beyond relational databases to include document databases, key-value stores, in-memory databases, and event streams.
The analytical layer evolved through data marts, distributed computing platforms such as Hadoop and Spark, data lakes, lakehouses, and vector databases. Each appeared because the previous generation struggled with new scale, new data types, or new workloads. An entirely new Data Science and AI layer emerged: data analysis, anomaly detection, machine learning, deep learning, LLMs, and agentic AI. And the output layer expanded beyond dashboards and reports into AI-powered applications, generated content, self-explaining AI systems, and autonomous agents. The most important change, however, is not any individual box. It is the connective tissue between them.
The Hinge: ETL Became Data Engineering
Three forces came together: more sources, more formats, and more scale. Traditional ETL tools, designed for a relatively uniform enterprise world, were no longer sufficient. Moving data was no longer the challenge. Moving every kind of data, at every scale, reliably and repeatedly, became the challenge. As data became structured, semi-structured, unstructured, and streaming — all at once — the old ETL abstraction started breaking. Different sources required different extraction, transformation, and loading logic. So engineers began writing those pipelines themselves.
That is where data engineering was born.
The idea never changed — we still Extract, Transform, and Load. What changed was the tooling and the ownership. Once we own the pipeline, we own everything that used to come built in. Governance — who can touch what, and under what rules. Quality — making sure the data is correct before anyone trusts it. Security — protecting it end to end. Management — cataloguing it, tracking its lineage, keeping it findable. And compliance — answering to regulators and auditors. None of this was our problem when the tool handled it. Now each responsibility becomes ours — and each one eventually became a discipline, and a career, of its own.
The Pattern
Strip the story to its mechanism and the same loop appears everywhere:
Tool → Data outgrows the tool → We own the problem → A new discipline is born → New roles appear
This happened with operational data systems. It happened when ETL evolved into data engineering. It happened when governance and security became engineering responsibilities. It happened again when analytics expanded into machine learning, deep learning, and AI. Every new capability demanded new expertise. That expertise became a specialisation. Every specialisation eventually became a new role, a new team, or a new discipline.
Once you see the landscape this way, the industry stops looking like a random collection of technologies. It becomes one continuous response to the same recurring problem: the data kept growing, the previous solution stopped being enough, and we built the next layer to handle it. The tools changed. The layers multiplied. The roles were born, renamed, and born again. But notice what never moved through any of it. Every box, old and new, exists to do one thing: turn data into value. Every box evolved. Data remained the centre.
The Human Spectrum
Most people know only a handful of AI job titles — Data Scientist, ML Engineer, AI Engineer, maybe Prompt Engineer or MLOps Engineer. It is easy to assume that small, familiar set is the field. It is not. It is a fraction of it. And the full list keeps changing — titles merge, split, and get renamed so often that the field can look fragmented, as if a new specialty is invented every few months. But these roles did not appear because someone invented new names. They appeared because the landscape itself evolved. Each title is a footprint — the mark left behind when a new capability grew large enough to need people dedicated to it.
Why One Role Became Many
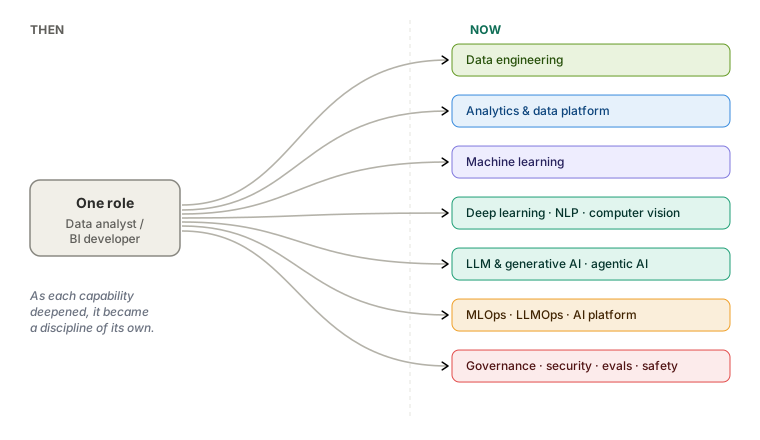
Not long ago, a single person could hold most of this together. In the structured enterprise world, one BI developer or data analyst could perform much of the analytical work end to end — pull the data, model it, build the report. The scope of the work fit inside one role.
Then the landscape expanded, and every new capability demanded deeper expertise than one generalist could carry. Moving and shaping data at scale became a full-time craft — data engineering became its own discipline. Building predictive models became its own discipline — machine learning. Then the same thing happened again, and again: deep learning, MLOps, LLM engineering, agentic AI. Each grew too deep to be a side skill. Each became a specialisation. And every specialisation eventually became a role.
Scale is what forces the split. In a small team, one person might still span several areas — ingesting data in the morning, training a model in the afternoon, wiring it into a product by evening. But as systems grow, the work in each area deepens until no single person can carry it all. What was one generalist becomes a team of specialists — not because the field wanted more titles, but because the work outgrew the person.
The Same Landscape, Seen as People
Every box in the previous section eventually needed people to own it. These are those people. We have been reading the landscape as an architecture — boxes, layers, pipelines. Here is the same picture read a different way: not as technology, but as the people who work in each layer. The roles are a representative sample, not a complete list — the field changes too fast for any list to be complete — but they show how far it has expanded beyond the few titles most people recognise.
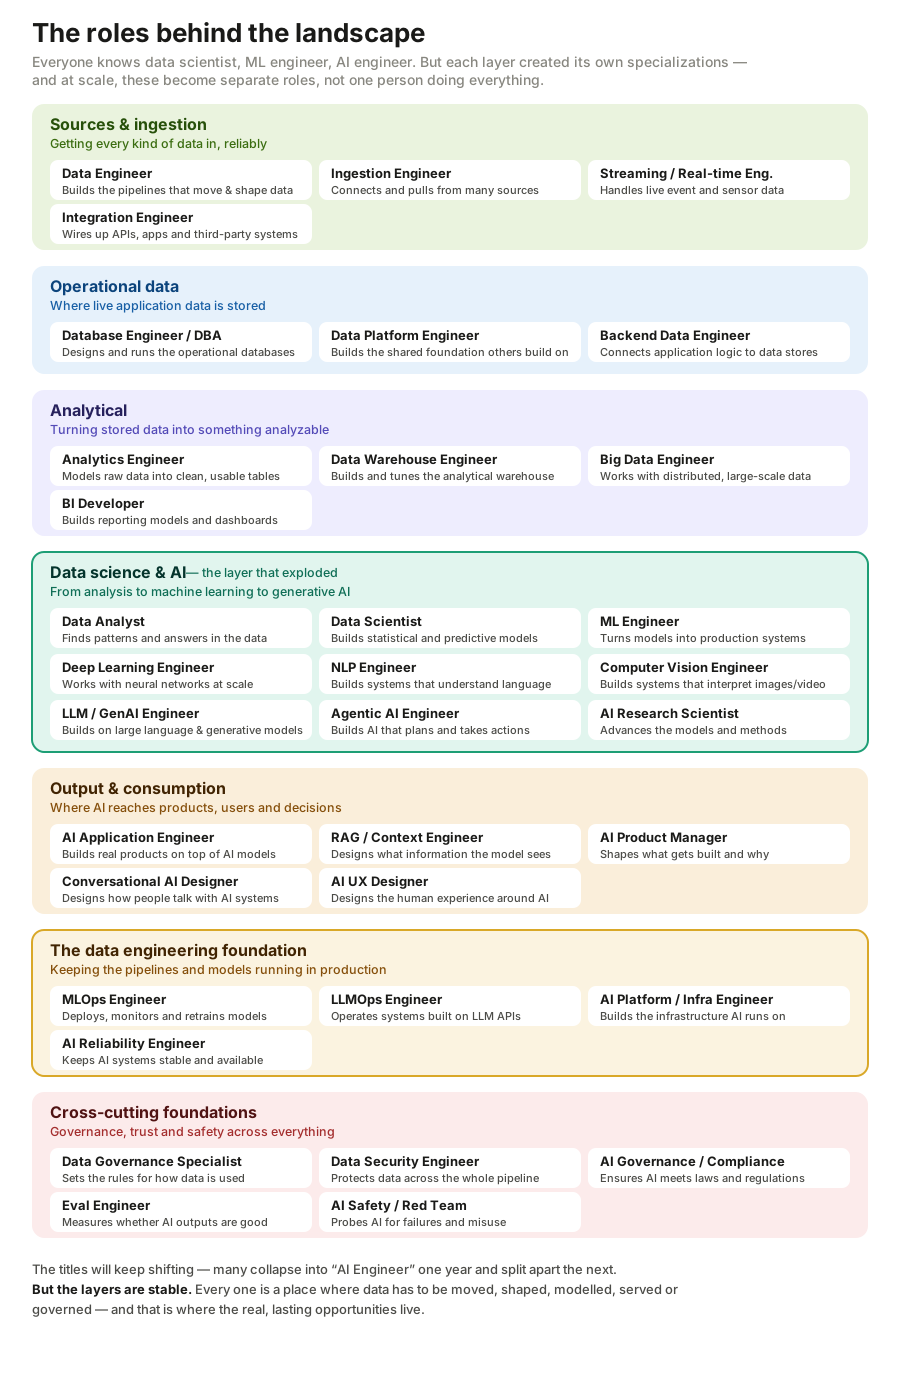
Look how much lives outside the three or four familiar titles. The single layer most people picture when they think of AI work — the data science and AI layer — has by itself split into nearly a dozen distinct specialisations. And that is one layer out of seven.
What Never Changed
The tools changed. The architectures changed. The job titles changed — and they will keep changing. Some roles on that map will merge; others will fracture into new ones; a label that commands a premium this year may be absorbed into a broader role the next. If you anchor your career to a fashionable title, you inherit that churn.
But the foundation never did. Underneath every role on that map — old or new, famous or obscure — is the same unmoving thing. Every one of them exists to move, understand, or create value from data. The titles are just the shapes the work takes at a given moment, at a given scale. Anchor yourself to the data, and to understanding what has to happen to it, and you inherit the stability instead of the churn.
The map will keep being redrawn. The territory stays the same.
You Don’t Need to Know Everything
Seeing a landscape this wide, it is natural to feel a little overwhelmed — as if being good in this field means mastering all of it. It does not. Nobody knows the entire spectrum deeply. The field is simply too wide, and anyone who claims otherwise is usually selling something.
The people who thrive over the long run share a different shape of knowledge. They go deep in their own role — that is where they build expertise. They understand the step immediately before theirs, where their inputs come from, and the step immediately after, where their work goes. That narrow band around their role is what lets them build reliable systems without quietly breaking something upstream or downstream. Beyond that, they stay aware of the rest of the landscape — not experts in every box, but aware that those boxes exist, what they are for, and how they connect.
That awareness is far more valuable than it first appears. The most expensive mistakes in this industry are rarely caused by a lack of depth in someone’s own specialisation. More often, they come from being blind to another part of the system — reinventing a solution another team shipped years ago, introducing a problem for a downstream team you did not know existed, or optimising one layer while unknowingly making the whole system worse.
Go deep where you stand. Stay aware of everything connected to it. That is what it truly means to work across the full spectrum of AI.
The purpose of this resource was never to convince you to become a Data Engineer, a Data Scientist, or an AI Engineer. It was to help you see that these are not isolated careers. They are connected parts of the same system. Once you understand that system, you can specialise with confidence without losing sight of the whole.
And whichever box you eventually stand in, notice what you will really be doing there. You may be collecting data, moving it, storing it, cleaning it, transforming it, modelling it, serving it, governing it, or protecting it. Your job title will change throughout your career. The tools will change. The technologies will change. Even the landscape itself will keep evolving. But the work underneath it all has remained remarkably constant.
Everything begins with data. Everything ends with value.
Prefer to keep it? Take the whole guide with you.
Download the PDF (free) ↓© 2026 Manoj Gunasekaran · Free to read, share, and teach from — with credit and a link back. Please don't republish, sell, or use commercially without permission.